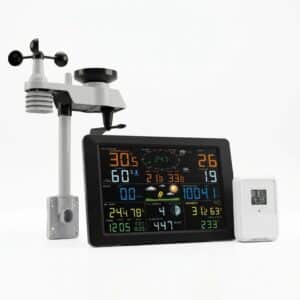
Real-time Climate Monitoring Center | Weather Station - Vinea Green

Vinaya Green

Live broadcast from the station

Climate and Urban Agriculture Center • 11 Hasadna St., Kfar Saba

Synchronization while: 60 Second
Temperature and climate area examination...
Last sample: --:--:--
Heat load: --°C
Wind chill: --°C
Daily minimum --°C
Daily maximum --°C
Climate stability proper
Compass and direction Active direction
Average speed -- km/h
Maximum gust (Gust) -- km/h
Relative humidity
--%
Dew point: --°C
Precipitation and daily rain
0.0 mm
rate: 0.0 mm/s No rain
Solar radiation
-- W/m²
Estimated lighting intensity: -- Lux
UV index
-- examination...
directive: --
Barometric pressure
-- hPa
Atmospheric condition: stable
VPD (Volatile Plant Derivatives) Index -- kPa Optimal for growth
Evaporation-daily (ET daily) -- mm Estimated water consumption
Topographic height 64 meters Sharon area / Kfar Saba
Synchronization frequency Every 60 seconds Direct server interface

Climate trends recorded at the station (last 7 days)

Loading data history from the station...
Local timeline (Kfar Saba time) Move mouse/finger over graph for values Vinea Green Station Data
Latest update from the station: Loading...
Official climate monitoring system • Vinea Green

Welcome to the Climate Monitoring Center Vinaya Green  At 11 Hasadna Street, Kfar Saba. The system transmits continuous real-time data from our meteorological measurement station, providing an accurate and updated climate picture for urban agriculture, green walls, hydroponic systems and ecological projects.

What does real-time monitoring include?

  • Temperature and heat load: Accurate measurement of air temperature, heat load, dew point and perceived temperature.

  • Unique agricultural index: Calculate the ideal vapor pressure deficit for controlling evaporation rate, plant diathesis, and green wall health.

  • Wind direction and speed: Detailed wind rose, current wind speed and maximum gusts.

  • Humidity and precipitation: Relative humidity, cumulative daily precipitation, and current rain rate.

  • Solar radiation and UV: Solar radiation intensity, UV index and exposure risk levels.

  • Trends and history: An interactive graph showing climate changes and trends over the last 7 days.